By Davide Barbuscia and David Randall
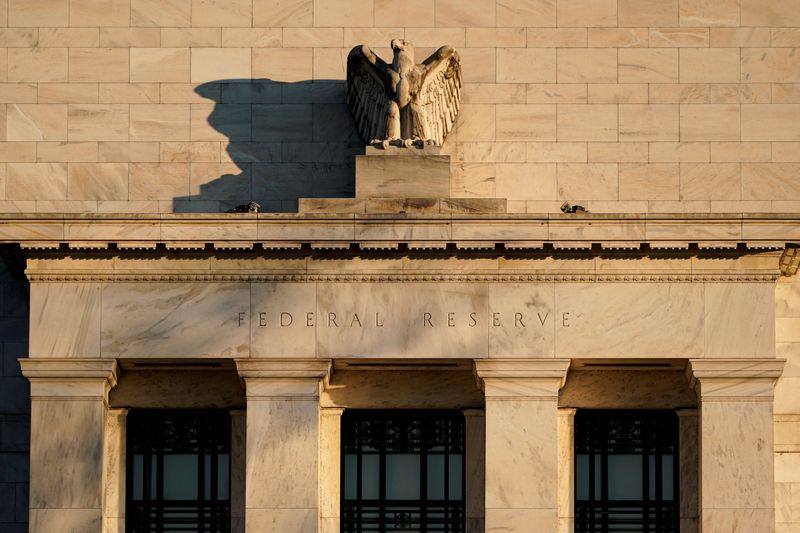
NEW YORK – The U.S. Treasury yield curve flattened further on Wednesday, as the Federal Reserve increased interest rates for the first time in three years and set out a path of tighter monetary policy to fight unabated inflation.
The shape of the yield curve is a key metric investors watch as it impacts other asset prices, feeds through to banks’ returns and has been an indicator of how the economy will fare. Recent moves have reflected investor worries over whether the Fed can tighten monetary policy to tame inflation without hurting economic growth.
Here is a quick primer explaining what a steep, flat or inverted yield curve means and whether the yield curve’s current shape is forecasting a recession.
WHAT IS THE U.S. TREASURY YIELD CURVE?
The U.S. Treasury finances federal government budget obligations by issuing various forms of debt. The $23 trillion Treasury market includes Treasury bills with maturities from one month out to one year, notes from two years to 10 years, as well as 20-and 30-year bonds.
The yield curve plots the yield of all Treasury securities.
WHAT SHOULD THE CURVE LOOK LIKE?
Typically, the curve slopes upwards because investors expect more compensation for taking on the risk that rising inflation will lower the expected return from owning longer-dated bonds. That means a 10-year note typically yields more than a 2-year note because it has a longer duration. Yields move inversely to prices.
A steepening curve typically signals expectations of stronger economic activity, higher inflation, and higher interest rates. A flattening curve can mean the opposite: investors expect rate hikes in the near term and have lost confidence in the economy’s growth outlook.
WHY IS THE YIELD CURVE FLATTENING NOW?
Yields of short-term U.S. government debt have been rising quickly this year, reflecting expectations of a series of rate hikes by the U.S. Federal Reserve, while longer-dated government bond yields have moved at a slower pace amid concerns that policy tightening may hurt the economy.
As a result, the shape of the Treasury yield curve has been generally flattening. A closely watched part of the curve, measuring the spread between yields on two- and 10-year Treasury notes, showed the gap at 24.5 basis points on Wednesday, over 60 points lower than where it ended 2021. That flattening increased on Wednesday after the Fed hiked rates.
While rate increases can be a weapon against inflation, they can also slow economic growth by increasing the cost of borrowing for everything from mortgages to car loans.
Two-year U.S. Treasury yields, which track short-term interest-rate expectations, have risen to 1.94% from 0.73% at the end of last year, a 166% increase.
U.S. benchmark 10-year yields have gone up to about 2.19% from 1.5%, a 46% rise. In February they topped the 2% level for the first time since 2019.
WHAT DOES AN INVERTED CURVE MEAN, AND WILL IT HAPPEN?
Some investors and strategists have forecast a curve inversion could happen, with short-term yields higher than long-term yields, as soon as this year – an ominous sign.
The U.S. curve has inverted before each recession since 1955, with a recession following between six and 24 months, according to a 2018 report by researchers at the Federal Reserve Bank of San Francisco. It offered a false signal just once in that time.
The last time the yield curve inverted was in 2019. The following year, the United States entered a recession – albeit one caused by the global pandemic.
DOES THE WHOLE CURVE INVERT OR PARTS OF IT?
Traders typically watch the shape of the curve determined by comparing two-year and 10-year Treasury notes, because a yield curve inversion on that spread has anticipated previous recessions. That curve is flattening but not yet close to inversion, with the spread down to 24.5 basis points on Wednesday from 29.10 a day earlier.
But distortions can occur anywhere along the curve without inverting the entire curve.
On Wednesday, the 5s/10s curve inverted in intraday trade. It switched back to positive territory but the gap was down to 0.4 basis points from 3.8 a day earlier.
A less closely watched part of the curve has inverted several times over the past few weeks, with the premium of U.S. Treasury 10-year notes over seven-year Treasuries closing in negative territory every day since March 11.
The 20-year/30-year spread has been negative since late October, though supply and demand technical factors may have contributed.
WHAT DOES THIS MEAN FOR THE REAL WORLD?
Aside from signals it may flash on the economy, the shape of the yield curve has ramifications for consumers and business.
When short-term rates increase, U.S. banks tend to raise their benchmark rates for a wide range of consumer and commercial loans, including small business loans and credit cards, making borrowing more expensive for consumers. Mortgage rates also rise.
When the yield curve steepens, banks are able to borrow money at lower interest rates and lend at higher interest rates. Conversely, when the curve is flatter they find their margins squeezed, which may deter lending.
(Reporting by Davide Barbuscia; Editing by Chris Reese)